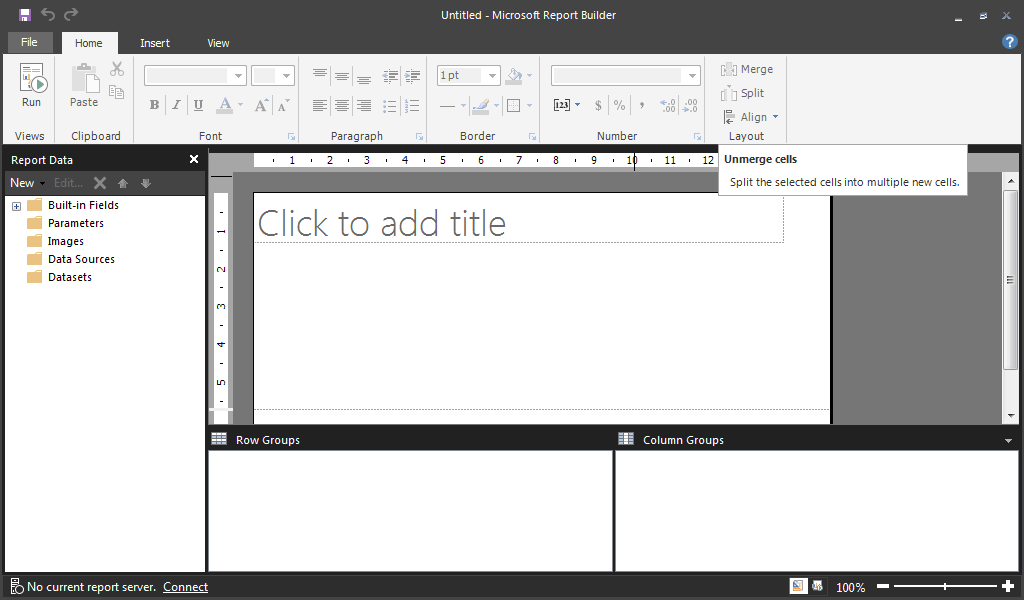
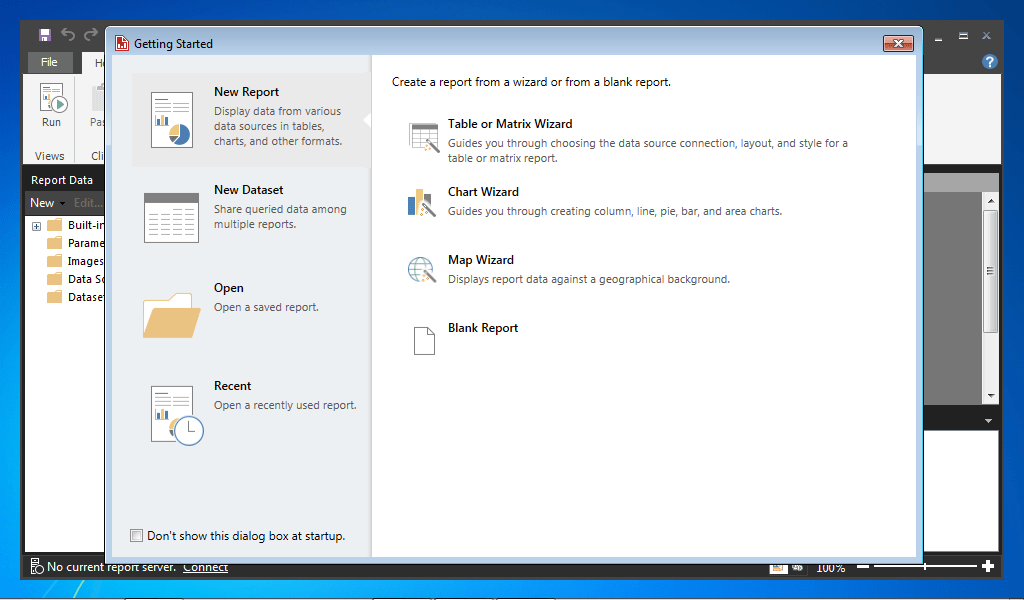
This utility enables IT professionals and advanced users to view data in their projects for creating reports. It also helps to visualize them conveniently.
Report Builder
Report Builder is a Windows application designed for professionals and advanced users. It allows you to visualize reports using tables and charts.
Creating reports
Report Builder allows you to create data sets to view the information within your projects. For example, you can make a table to determine if test coverage is sufficient and to ensure that defects are detected and tracked.
You can set conditions to capture only the required data. It is also possible to allow the changing of terms while the report is running so that other organizations can create their own statements based on it. In this case, you will need to make a diagram of the requirements, the related test suites, and associated defects.
Viewing reports
To view the table, you need to choose the All Reports or My Reports option from the list. To further edit the record, you have to click the pencil icon in the Selected by me area on the right. Save button allows you to apply the changes.
You can export the report in formats such as Microsoft Word, PDF or HTML. Adobe Reader is suitable for further work with PDF files.
To make more changes to the report, there is an option to export it to the Rational Publishing Engine if a license is available. You can also output the schedule to an image file.
Features
- allows you to speed up the report creation process;
- free to download and use;
- compatible with modern versions of Windows;
- visualization via charts and tables;
- allows you to export data in various formats.


