This scientific software is intended for multivariate statistical analysis. It is possible to generate various types of graphs and charts to visualize the data.
MVSP
MVSP is a Windows utility that helps users perform nominal, ordinal, interval, ratio and binary analysis of any input data. There are instruments for importing information from various sources, including Excel, SPSS SamplePower and SYSTAT as well as for entering raw values manually.
Main purpose
With the help of this program you can conduct exploratory, cluster and correspondence analysis. Moreover, it is possible to identify principal components and canonical variates in the data.
The main toolbar contains buttons for importing information from external spreadsheets and other sources. Users are able to edit, transform, filter and sort the values according to project requirements.
Analysis
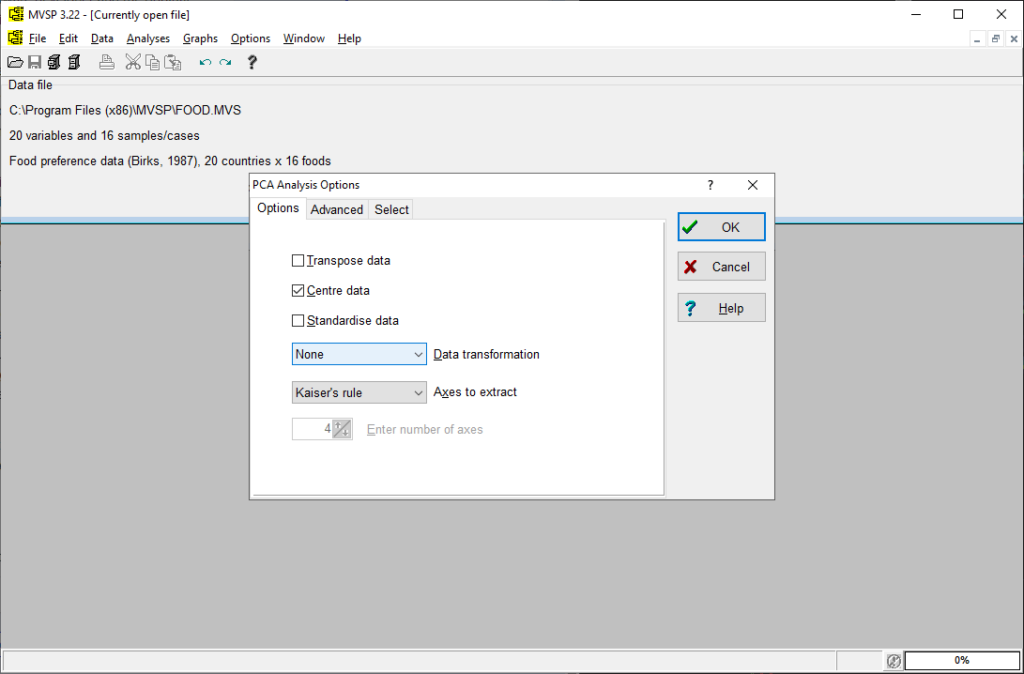
You can select one or several methods from the main menu and specify the parameters for each operation. There are instruments for choosing which variables to include or exclude from the analysis.
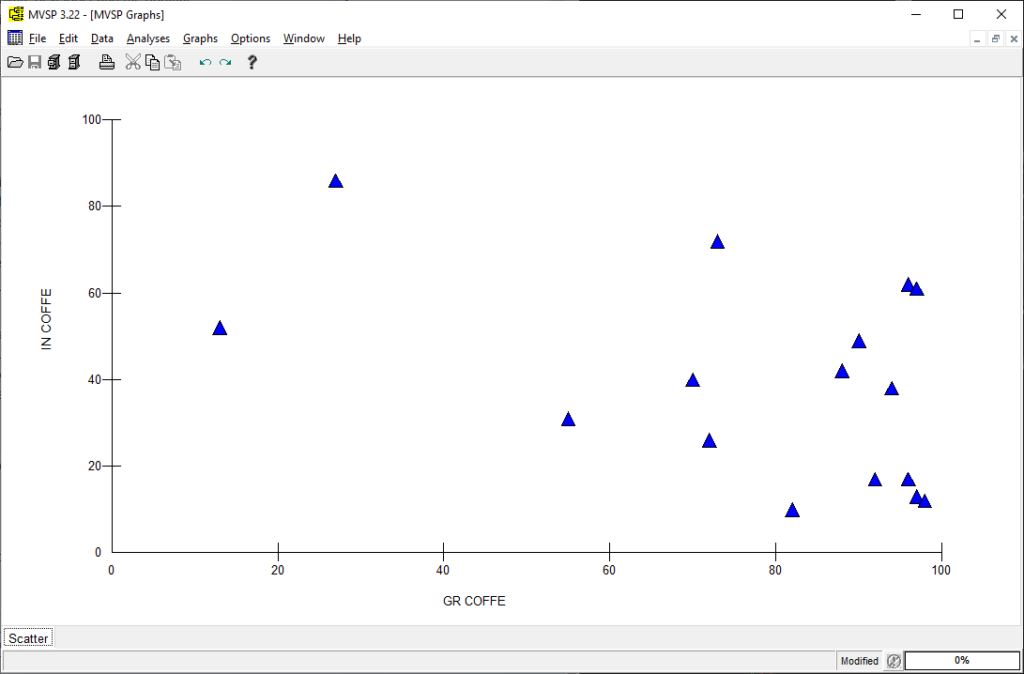
The results are displayed in a separate window with tables, matrices, statistics and trends. Users are able to automatically generate scatterplots, dendrograms, biplots and other types of graphs to visualize the data.
Features
- intended for performing complex statistical analysis operations;
- free to download and use;
- you can import information from various external sources or enter the values manually;
- it is possible to create custom graphs and plots to visualize the results of the analysis;
- compatible with all modern versions of Windows.


