CLR Profiler

CLR Profiler

0/5
ver. Fall 2012
7 Mb (downloads: 2)

This tool was developed to assist users in analyzing the behavior of apps. It is possible to view the data in histogram, timeline, and allocation graph modes.

Download
Update date:
01.02.2024
Developer:
Microsoft Corporation
Windows version:
Windows 2000

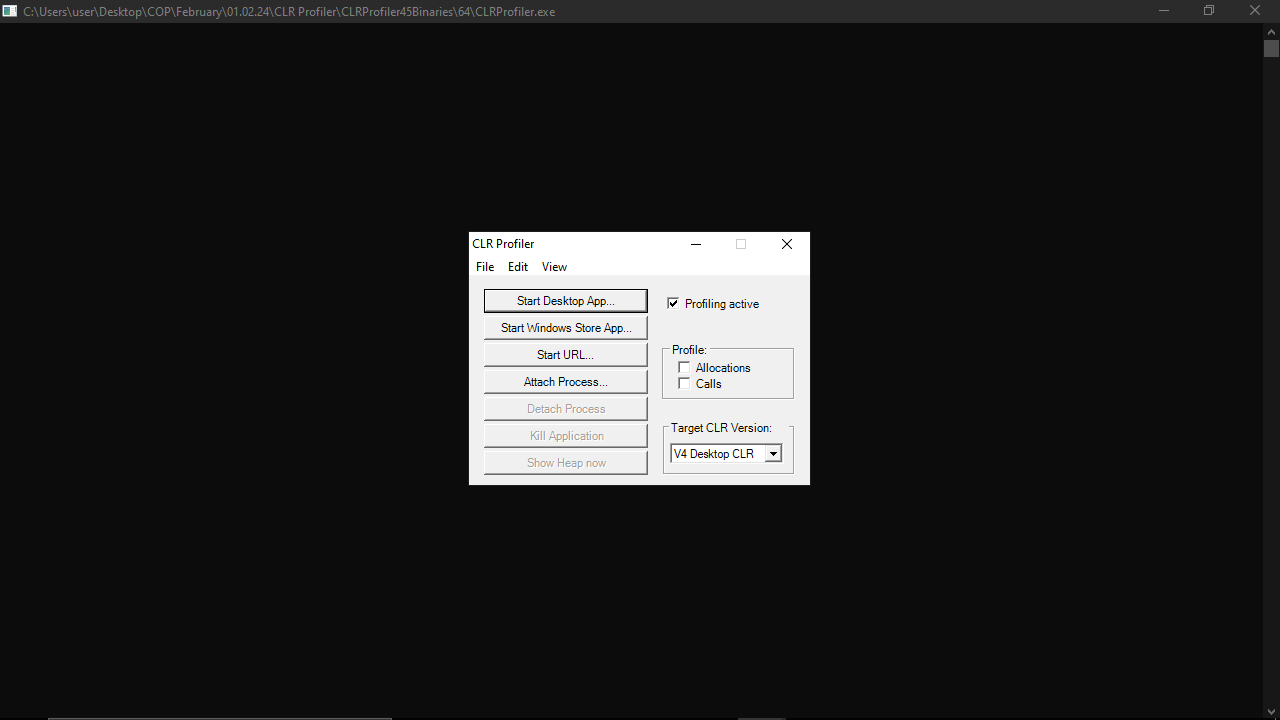
CLR Profiler is a program for Windows aimed at developers, providing insights into the allocation profile of their managed applications. Specifically, it allows users to find more about the methods assigned to various types of objects, examine the contents of the collector heap, and so on.

Introduction

It is worth noting that the project is no longer actively maintained. This may impact its compatibility and effectiveness, particularly for use in apps developed more recently. Nevertheless, the software is available for download from the Microsoft Archive page on GitHub. If you would like to construct optimization profiles, you may try another program called dotTrace.

Demanding performance

Please note that the utility can be quite intrusive. According to the developers, you may experience a slowdown of ten to hundred times in the applications you are profiling. The log files generated during the analysis can be large. However, you can mitigate the risk of excessively heavy items that consume space by toggling the allocation and call logging features.

Multiple data views

The tool offers a variety of views of the allocation profile. These include a histogram of allocated types, allocation and call graphs, a timeline displaying garbage collection of different generations, as well as the resulting state. Last but not least, you can bring up a call tree showcasing per-method allocations and assembly loads.

Features

  • free to download and use;
  • compatible with modern Windows versions;
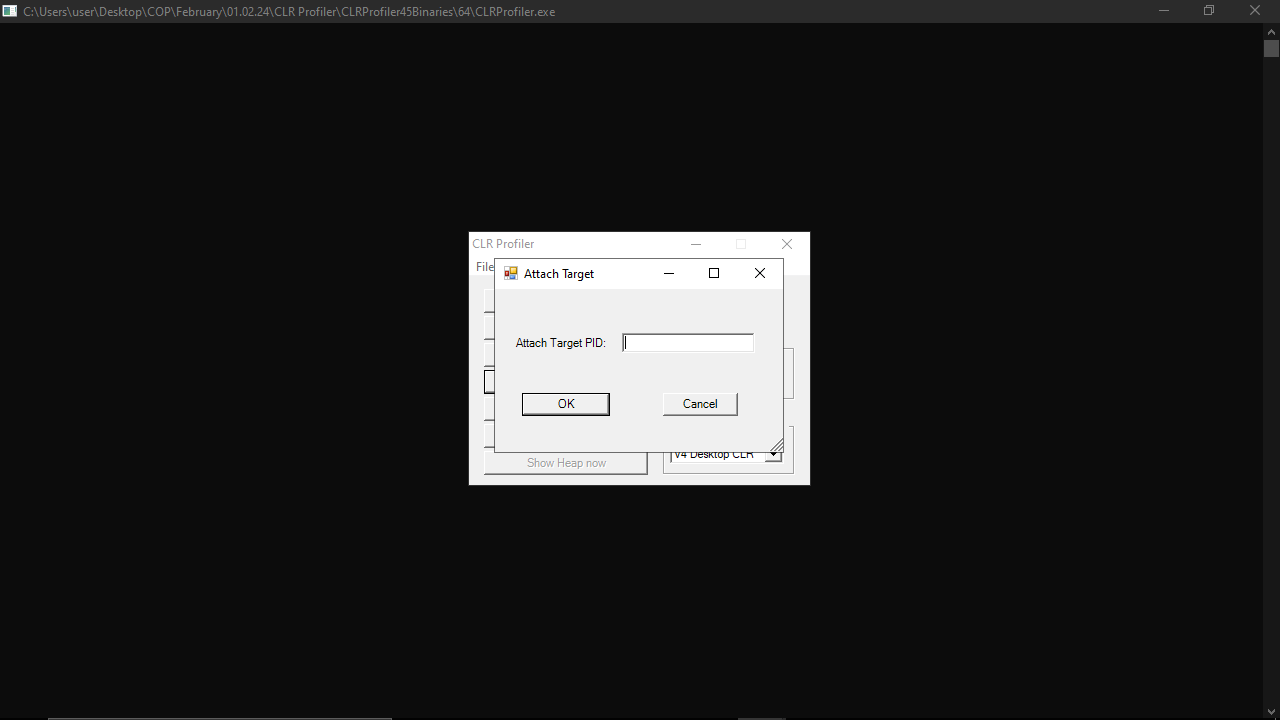
  • gives you the means to monitor app behavior;
  • you can preview the summary of your analysis;
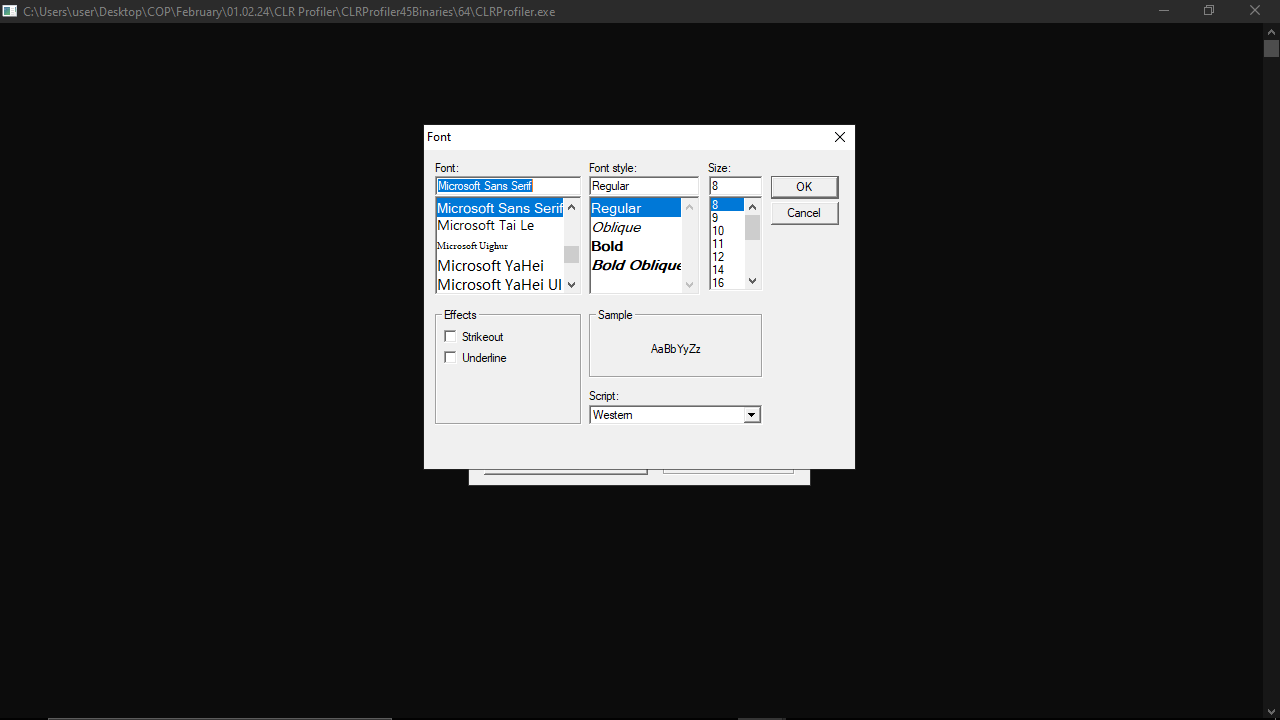
  • there is an option to change the GUI font.
Download
7 Mb (downloads: 2)
Add comment
0/5
Similar programs
MyDiskFix MyDiskFix
Windows XP, Windows Vista, Windows 7, Windows 8, Windows 8.1, Windows 10 Free
3/5

This program allows you to format the storage device and determine its actual capacity. The utility works with the majority of flash drives models and memory cards.

ver 1.0
MSI Kombustor MSI Kombustor
Windows XP, Windows Vista, Windows 7, Windows 8, Windows 8.1, Windows 10 Free
0/5

With this benchmark, users can analyze the performance of the graphics adapter. There is also an option to evaluate the effectiveness of the cooling system.

ver 3.5.0.4
System Ninja System Ninja
Windows XP, Windows Vista, Windows 7, Windows 8, Windows 8.1, Windows 10 Free
0/5

This program is a tool for cleaning hard drives from unnecessary data. There is an option to delete temporary files and cache to improve computer performance.

ver 3.2.9
HDD Regenerator HDD Regenerator
Windows XP, Windows Vista, Windows 7, Windows 8, Windows 8.1, Windows 10 Free
0/5

This program allows you to recover damaged sectors of the hard disk. The app supports various drive models. It is possible to fix hardware and software errors.

ver 20.11.0011
HWMonitor HWMonitor
Windows XP, Windows Vista, Windows 7, Windows 8, Windows 8.1, Windows 10 Free
4/5

This program provides information about the status of the central processor, hard drives, and video card. It is possible to check the temperature and voltage.

ver 1.42.0
Ookla Ookla
Windows 7, Windows 8, Windows 8.1, Windows 10 Free
0/5

This program allows you to measure incoming and outgoing data transfer speeds. The utility offers the check up results and automatically detects your location.

ver 1.7.132.1
GPU Z GPU Z
Windows XP, Windows Vista, Windows 7, Windows 8, Windows 8.1, Windows 10 Free
0/5

This program allows you to find out the model of the graphics card, DirectX version, and other specifications. The temperature monitoring function is also available.

ver 2.35.0
RAMMap RAMMap
Windows Vista, Windows 7, Windows 8, Windows 8.1, Windows 10 Free
1/5

This program allows you to check the amount of RAM consumed by running processes. There is a full list of active services that affect your computer’s performance.

ver 1.60