This software solution was developed to help you create histograms of listmode files. Moreover, you have the ability to save the reports as a text document.
WinMDI
WinMDI is a comprehensive program for Windows that allows users to analyze the flow of cytometry data saved in FCS2.0 format. It provides different evaluation functions such as generation of regions or quadrants, overlays of basic statistics. The data may be exported as bitmap images, and the report itself can be saved as a text file. If you need to convert it to PDF, you may use a virtual printer utility called CutePDF.
General notes
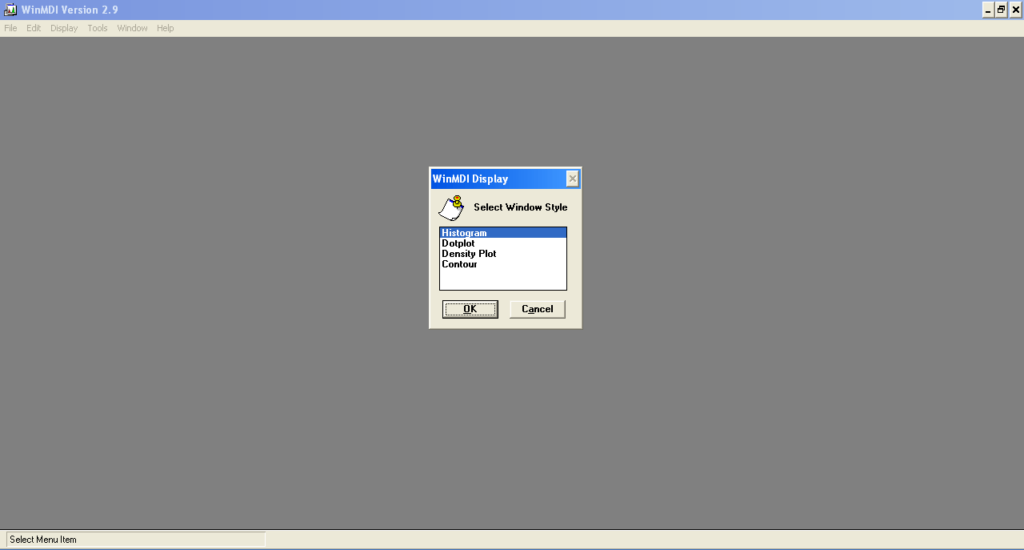
To start the application, you can simply click on its desktop icon, or launch it via the Start menu. Next, you have the ability to create single-parameter, dual-parameter, also known as cytograms, and even three-dimensional histograms. It is necessary to note that the display dialog window provides four different graph styles:
- Histogram – presents one or more parameters as a frequency distribution;
- Dotplot – shows correlated data from any two parameters. Each dot is assigned to an event analyzed by the flow cytometer;
- Density plot – displays two parameters as a frequency distribution with color used to mark different frequencies of events;
- Contour plot – provides view of the correlated data from any two parameters along with lines joining points of equal elevation.
Create a histogram
In order to create your first graph, you need to go to the display dialogue window and select the Histogram style. Next, a new window will appear and allow you to navigate to the sample folder where the listmode data file is stored. When the item is selected, you can select different parameters you want to display and click on the Read button to view the corresponding histogram.
Features
- free to download and use;
- compatible with modern Windows versions;
- allows you to create histograms of listmode files;
- it is possible to choose from four graph styles;
- you can save the report in text format.


