This utility allows you to analyze statistical data and establish dependencies. Additionally, there are interactive tools for visualizing the information.
Statgraphics
Statgraphics is a Windows software for studying, processing and analyzing data acquired during scientific experiments and research. There is a wide variety of instruments for statistical variable description. Users can identify dependencies.
Data processing
This program is widely used for finding correlations between several variables. It contains modules for conducting sociological surveys and organizing medical research. Moreover, you are able to solve issues related to product quality control and risk assessment.
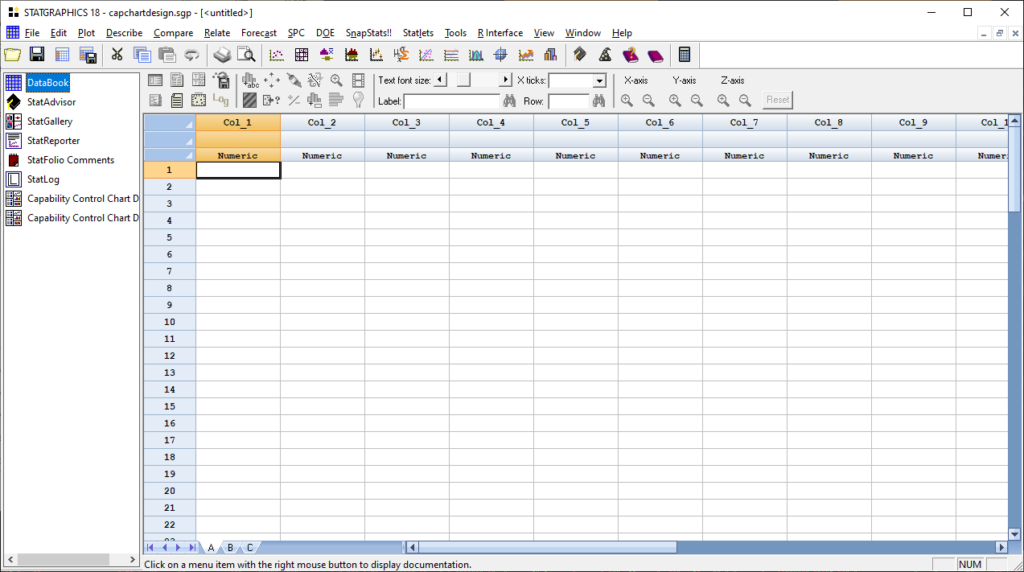
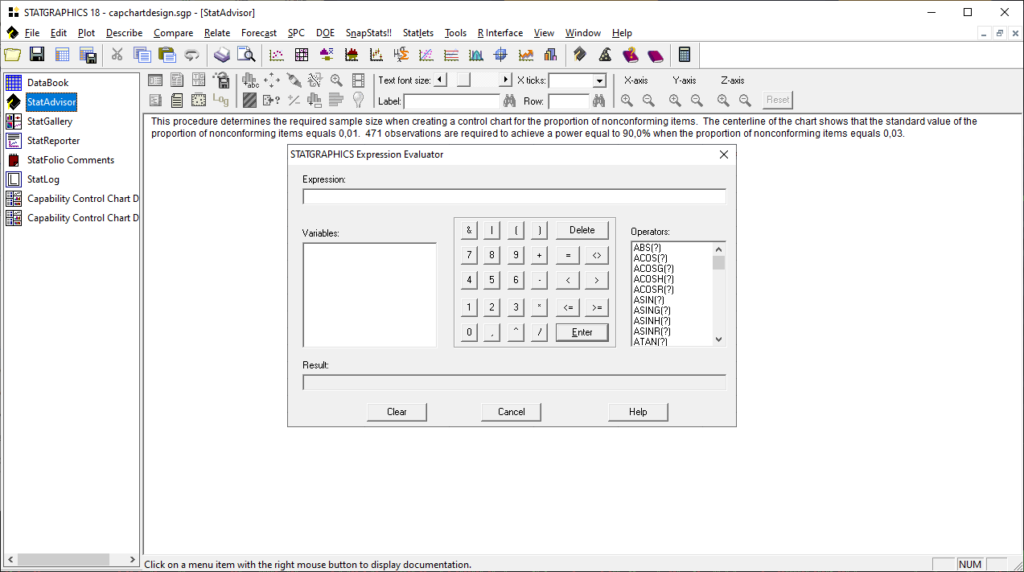
Data manipulation is performed by creating several windows in the workspace. Users can import source information from a file or enter it manually. A powerful interactive calculator for analyzing probability distribution structure is provided.
Visualization
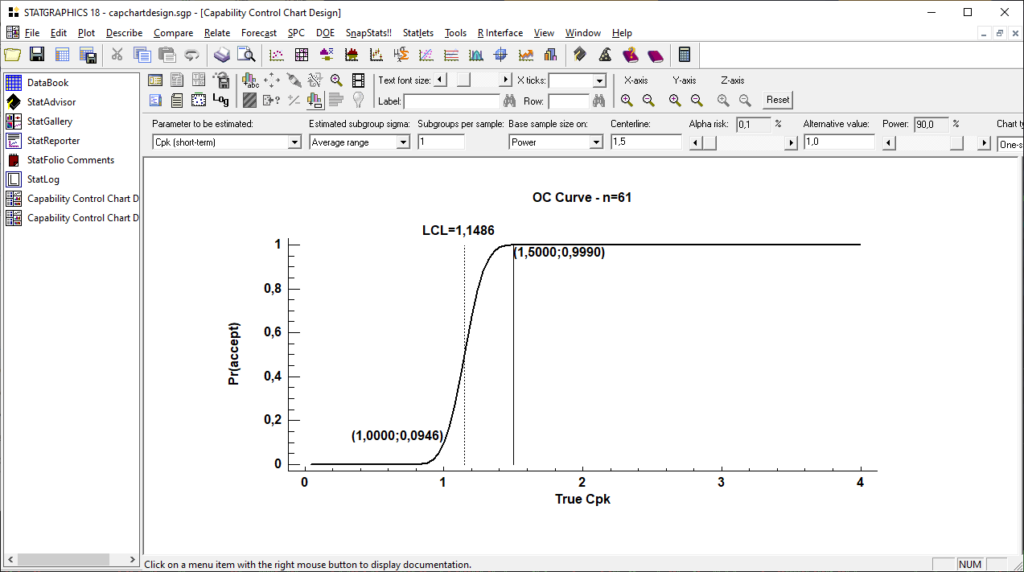
Like in Autograph, there are tools for constructing various graphs and diagrams based on statistical data. You are able to resize separate elements as well as add artistic filters and special effects. It is possible to export analysis results to a file.
It is worth noting that Statgraphs is a paid software. Users can evaluate the trial version without payment for 30 days.
Features
- intended for data processing and analysis;
- free to download and use;
- you can build graphs to visualize the information;
- there are instruments for performing dispersion analysis;
- it is possible to process large databases with up to 32 thousands variables;
- compatible with all modern versions of Windows.


