This software package contains powerful instruments for building scientific graphs and diagrams as well as performing statistical data analysis operations.
SigmaPlot
SigmaPlot is a Windows program oriented toward researchers, scientists and engineers. It allows you to generate precise graphs for a wide variety of purposes. There is a collection of standard statistical tests and a library of 2D and 3D visual templates.
Graph creation
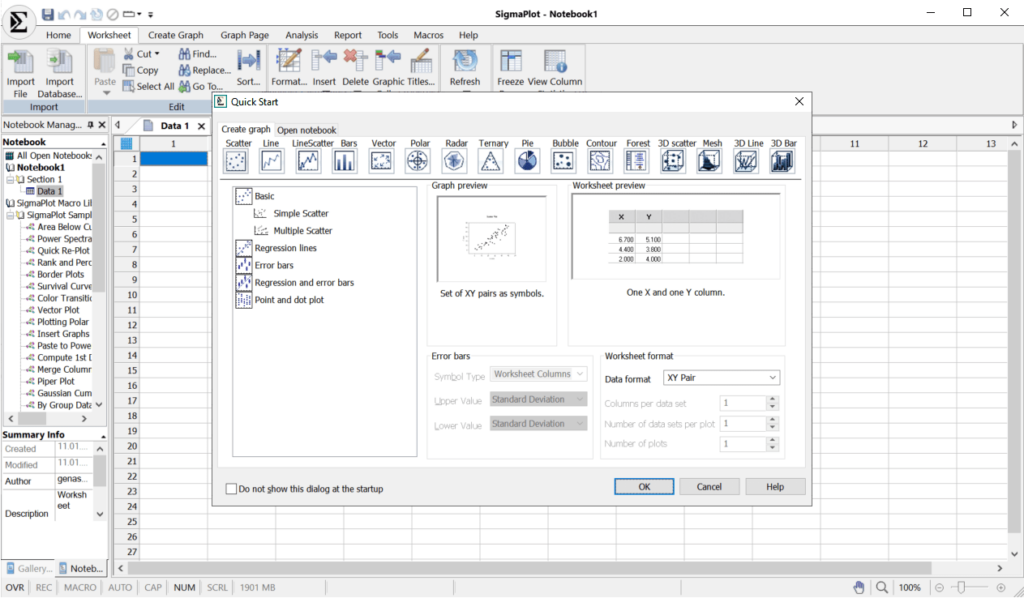
After starting the utility users are prompted to begin a new blank project or choose one of the provided graph types. Options for creating line, vector, polar, radar, pie, mesh and other kinds of diagrams are available. Users can choose the correct data format and preview the graph.
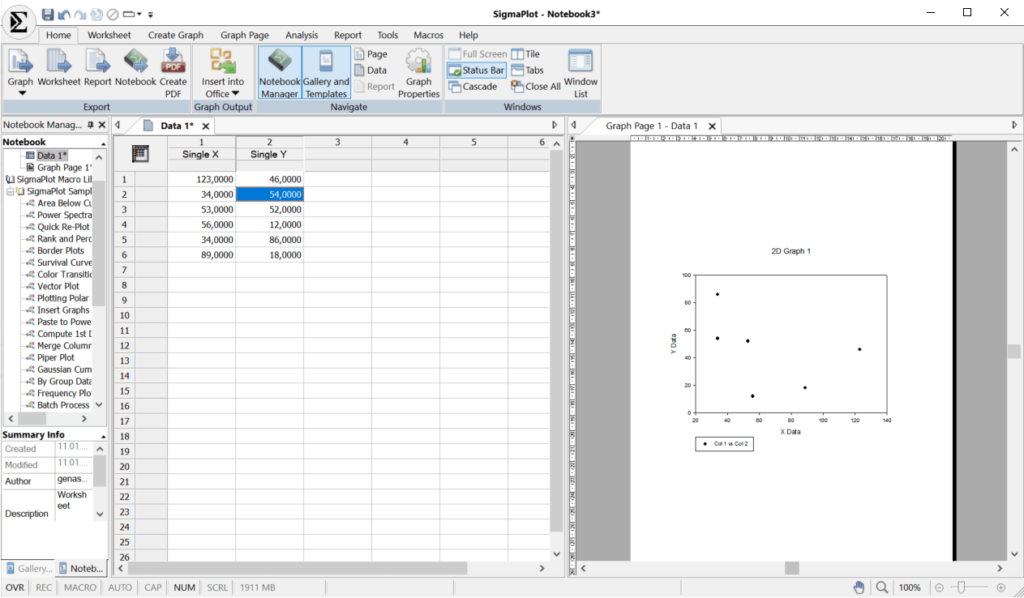
It is possible to manually enter all values required for the project. Alternatively, you are able to import information from Excel spreadsheets and MySQL databases.
Statistical analysis
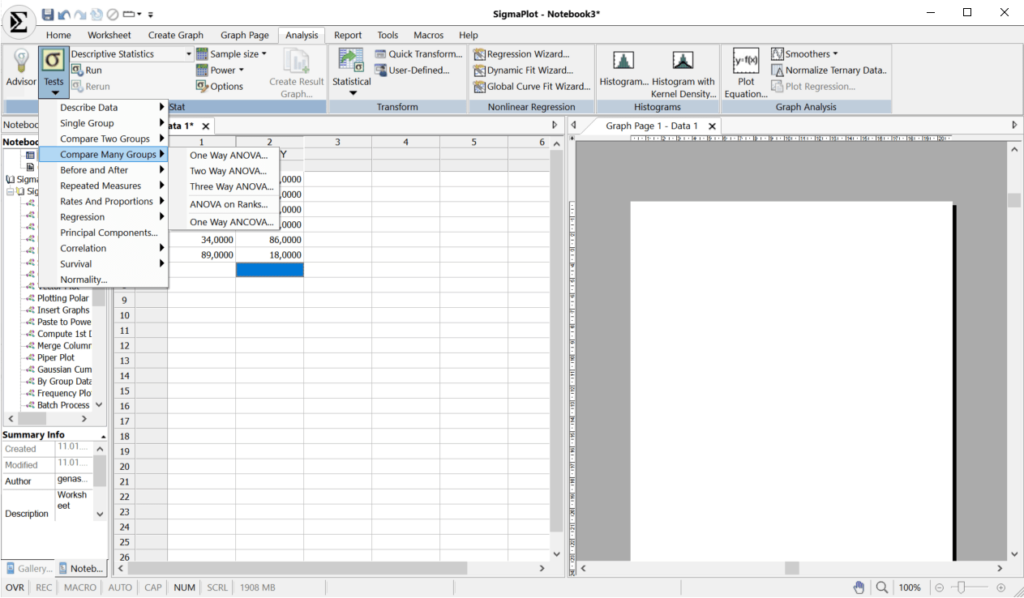
There are flexible instruments for performing various tests and transformations. Users can compare multiple groups, identify data correlations and normalize the results.
Macros for automating routine tasks are provided. There are commands for computing the area under the curve, splitting columns, adding labels to line plots and viewing clustered heat maps. Moreover, you are able to record and execute custom scripts.
It is worth mentioning that the free trial version of SigmaPlot will stop functioning 30 days after installation.
Features
- offers you tools for creating and modifying complex scientific graphs;
- free to download and use;
- there is a collection of project templates and samples;
- macro commands for automating repetitive tasks are available;
- compatible with all modern versions of Windows.


