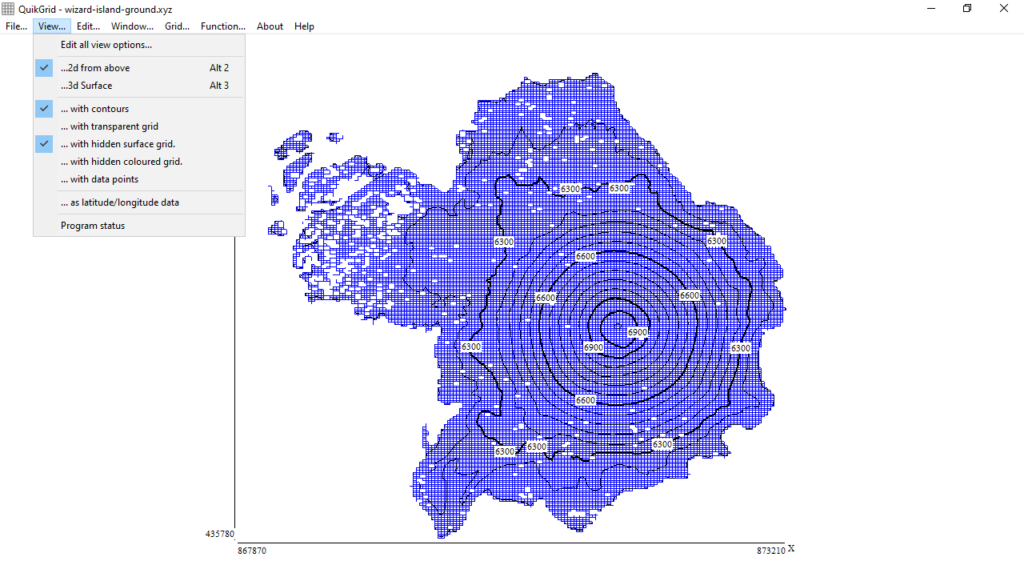
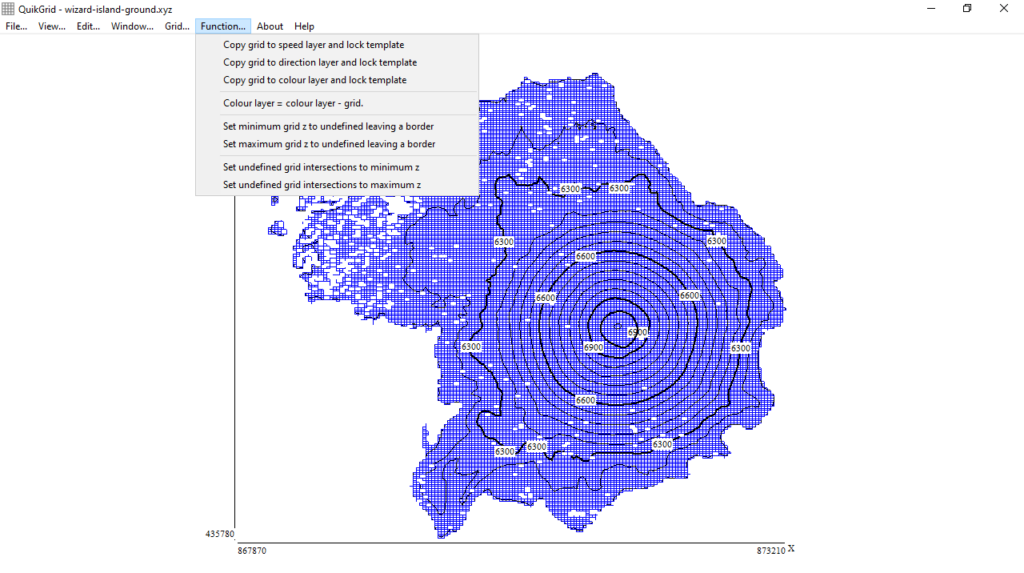
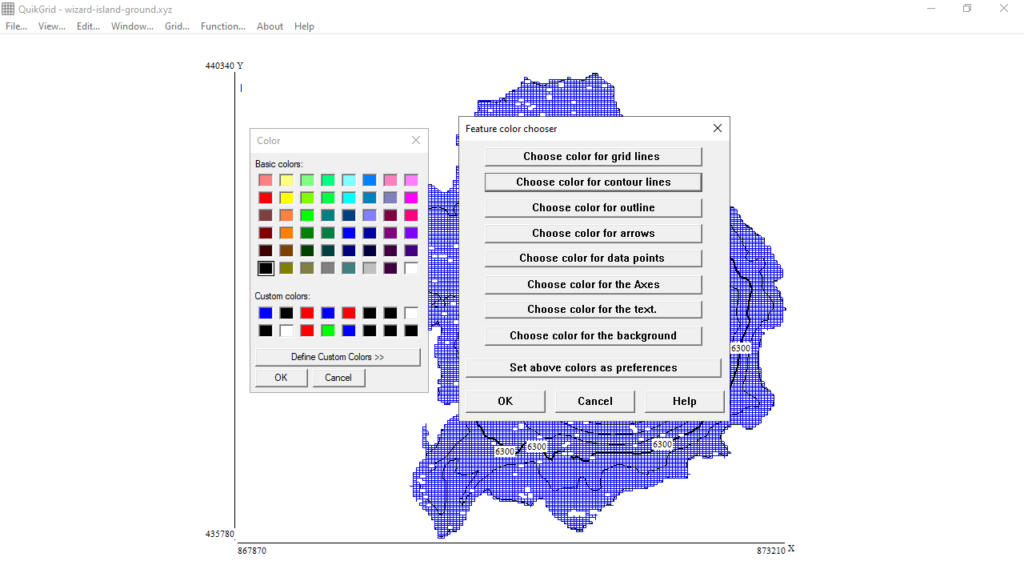
The software solution allows users to generate 2D or 3D grids from scattered data points. There is support for customizing colors of various elements.
QuikGrid
QuikGrid is a program for Windows designed to process a set of scattered data points representing a surface. It efficiently generates a grid from this information and offers options to produce a visualization as either a contour map or 3D representation.
Simple navigation
The navigation is straightforward. The left mouse button enables zooming in and panning around the display. Meanwhile, the right mouse button offers functionality to show detailed information about the generated grid coordinates and data points. To render crystal structures, you may use software like CrystalExplorer.
Visualize and export grids
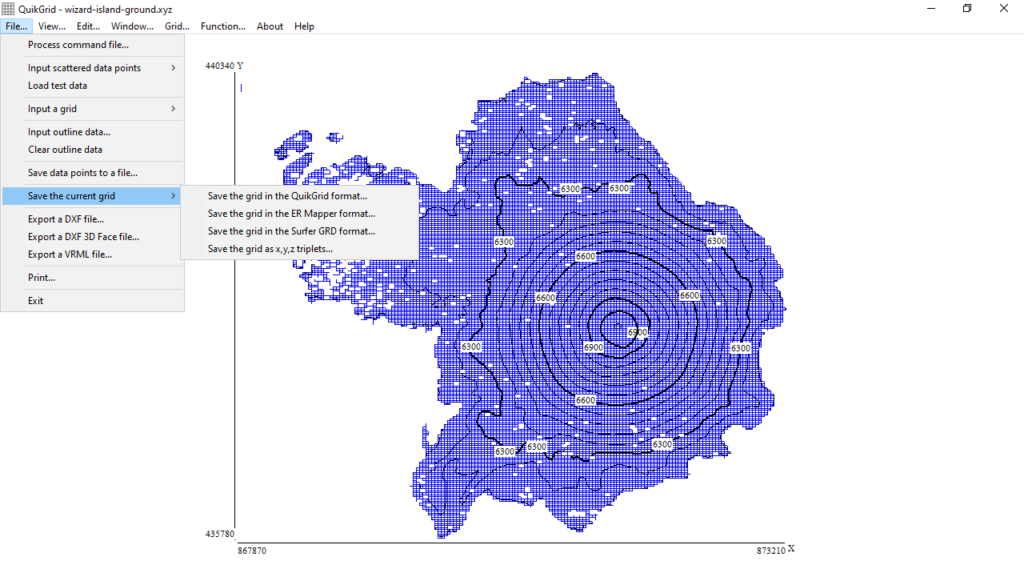
The grid can be visualized as a wireframe or a hidden surface grid, with optional coloration. Please note that both the grid and contour lines can be exported as DXF items. You have the option to output to a file in various formats, including a series of XYZ triplets, with DXF 3DFACE extension, or as an ER Mapper Raster Dataset. There is also support for viewing 1 degree USGS DEM items.
Advantages
The application is user-friendly and runs efficiently on modest hardware platforms. It is particularly helpful in scenarios where a quick analysis of a set of data points is needed. For example, in the field where only a portable computer is accessible. Moreover, there is extensive documentation, providing you with guidance and support.
Features
- free to download and use;
- compatible with modern Windows versions;
- enables you to generate grids using data points;
- you can switch between 2D and 3D view modes;
- it is possible to export projects in various formats.


