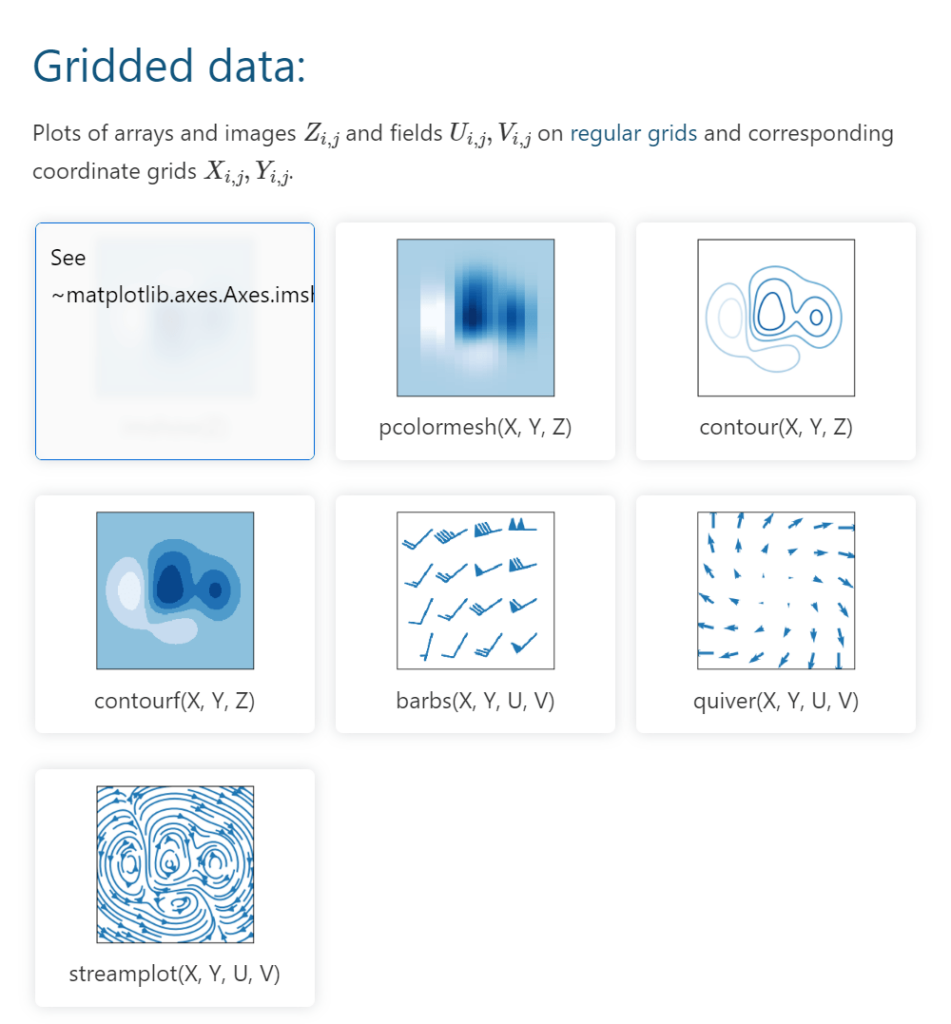
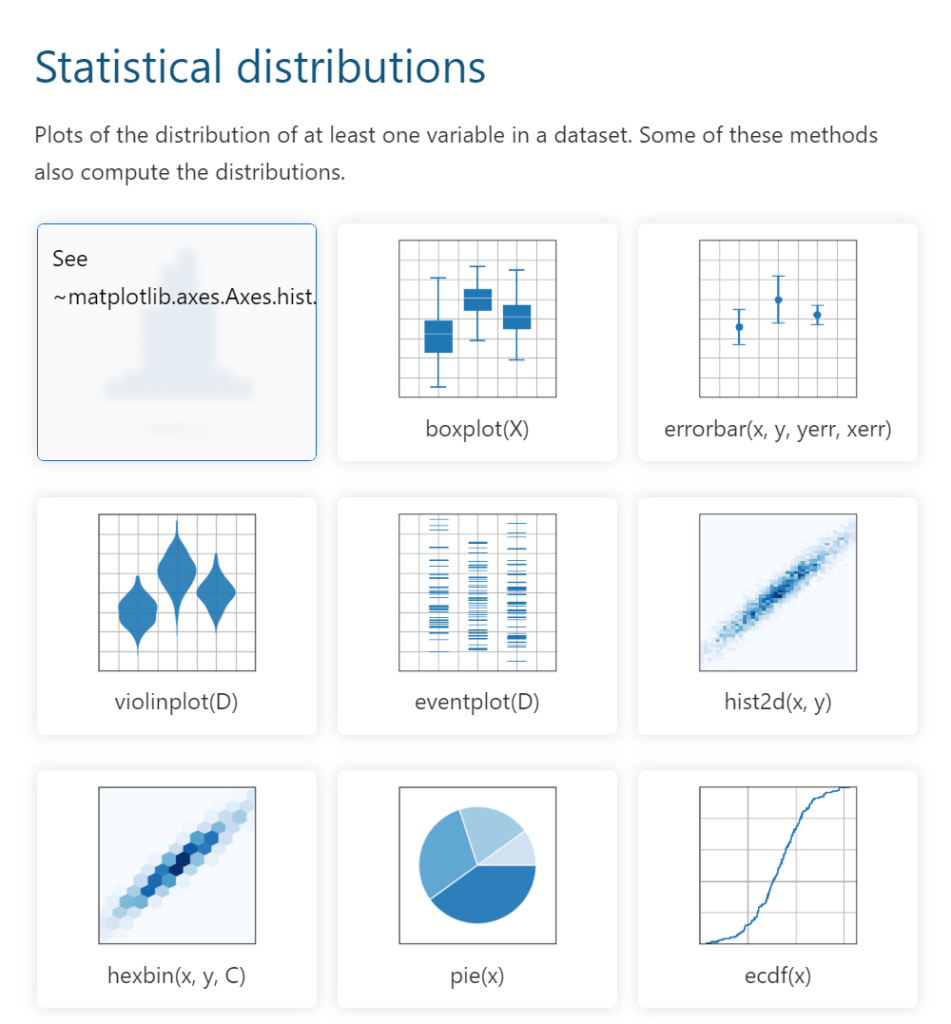
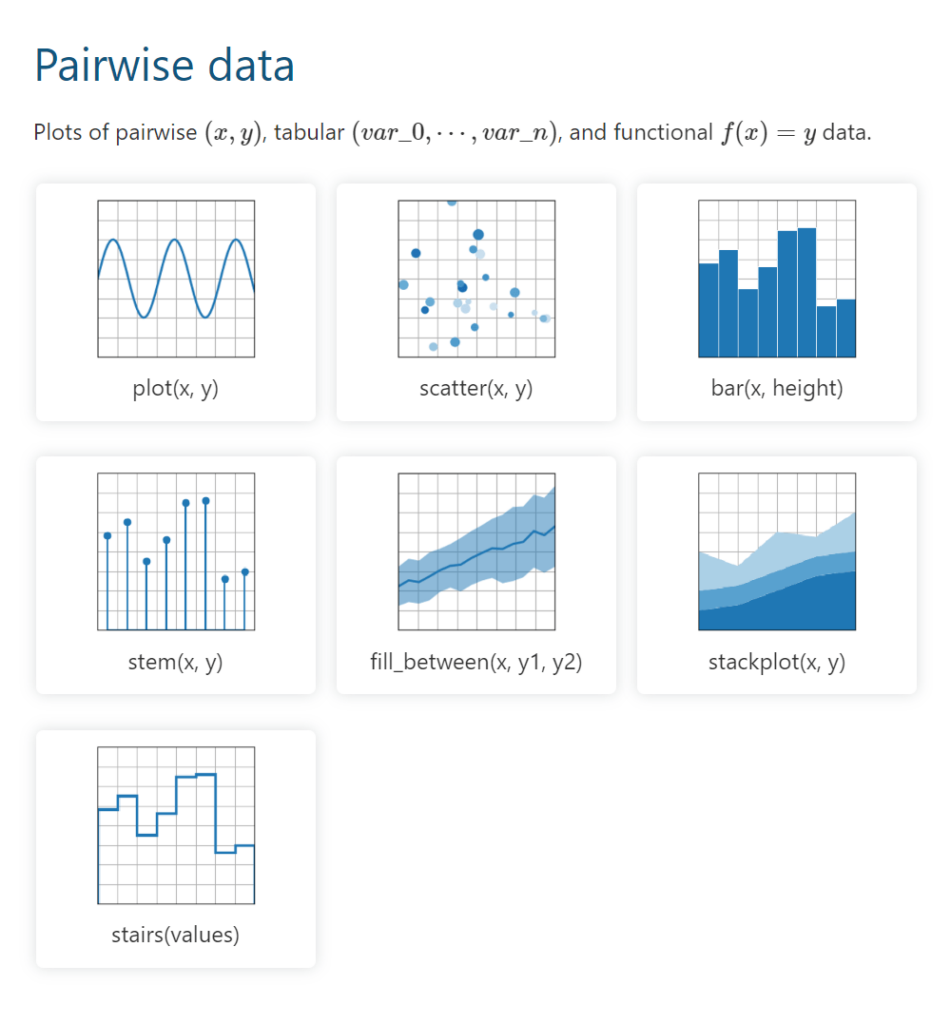
Using this Python 2D plotting library developers can create graphs and diagrams in various interactive environments. There is support for several hardcopy formats.
matplotlib
matplotlib is a Windows development tool for generating static, animated and interactive visualizations in Python. You are able to create scatter plots to analyze the relationship between two variables as well.
Main purpose
This Python library allows users to visualize trends and patterns in datasets in the form of line plots. There are instruments for creating bar graphs to compare categorical values.
You can analyze the distribution of information by generating detailed histograms. Pie charts, in turn, are effective for displaying proportions of percentages.
An option to view 3D plots for processing complex data in three dimensions is provided. Additionally, it is possible to create animations to better understand complex dynamic operations. Supported export file formats include PNG, PDF and SVG.
Customization
Users are able to change various aspects of the plot like color, line styles and markers. Tools for adding personal annotations are included as well. There is a collection of colormaps for enhancing the visual representation of data. Moreover, multiple subplots can be combined into a single figure.
Features
- provides a development library for Python;
- helps you visualize large datasets in the form of plots, graphs and diagrams;
- free to download and use;
- there is support for the PNG and SVG output formats;
- users can generate detailed histograms to analyze data distribution;
- compatible with all modern versions of Windows.


