Thanks to this utility, users can work with various data collections. Additionally, they have the ability to draw prediction graphs and perform peak integration.
Logger Pro
Logger Pro is a compact program for Windows designed to help you analyze large data sets. Thanks to its powerful features, it is suitable for both professional researchers and students alike.
General notes
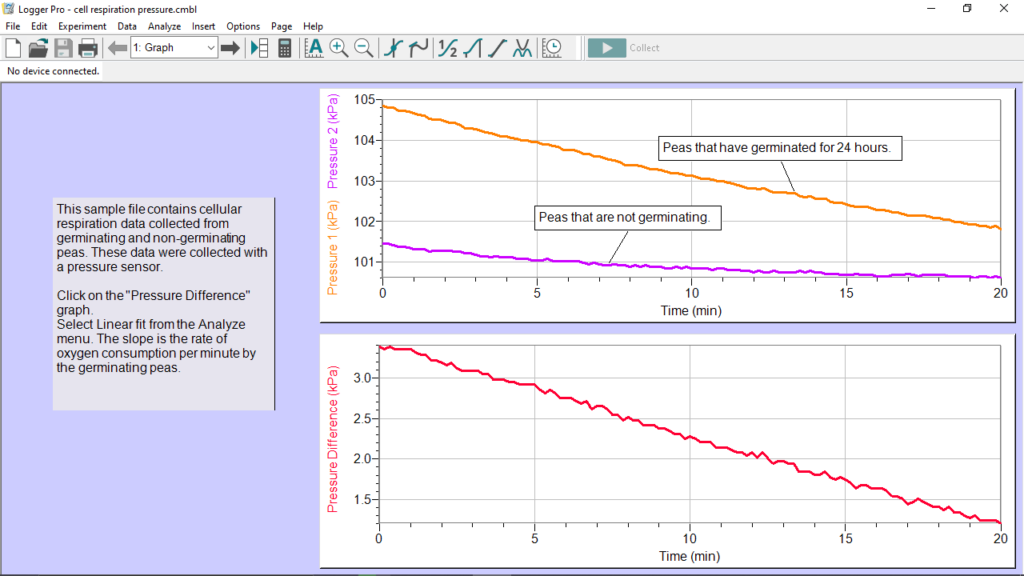
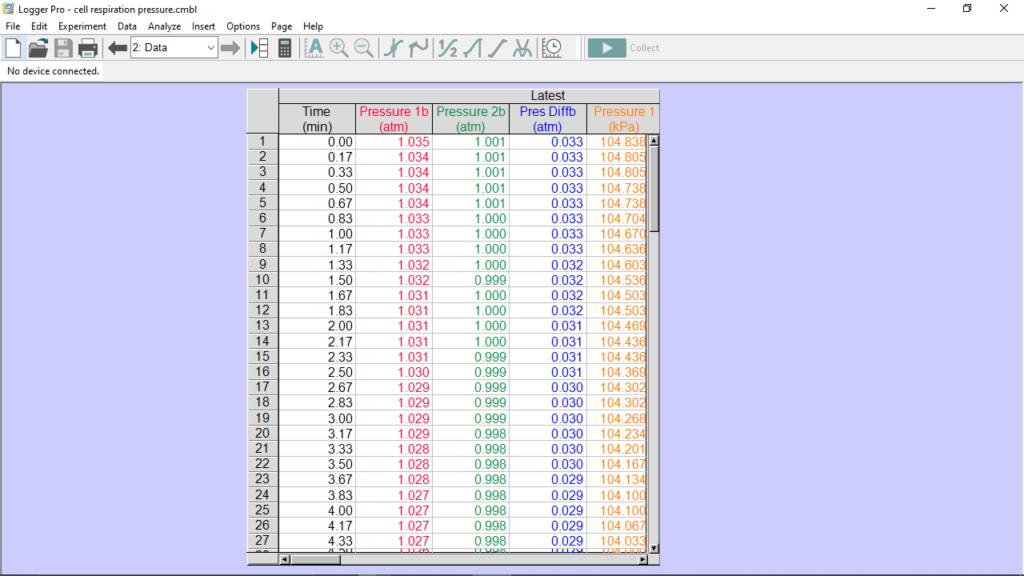
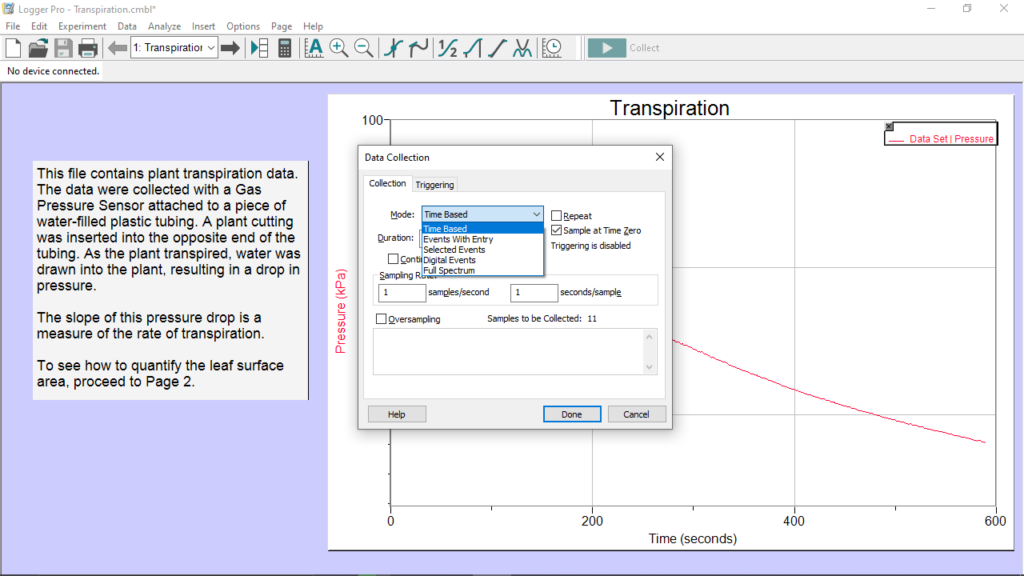
The software solution enables you to build a real-time graph by simply inputting the desired data collections. When entering a new value, the display updates automatically. Similar to spreadsheet utilities such as OfficeSuite or LibreOffice, you are able to add new columns based on other data and include them in your current graph. It is necessary to mention that there are multiple types of data sets that you can create, from digital events to time based ones.
Chart customization
Thanks to in-depth customization, you have the ability to configure the chart. For example, it is possible to change its title, color and add a legend. In addition, you can adjust its appearance according to your needs by modifying the axes and grid styles.
Additional elements
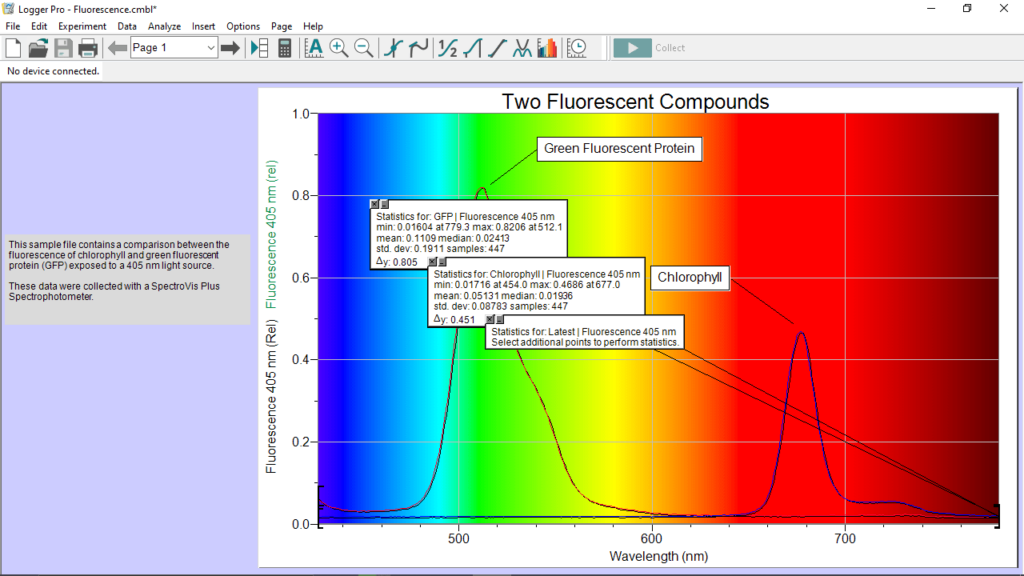
What is more, the application gives you the ability to add extra elements to your graph, like text annotations, images, videos or different meter types. You are also able to highlight various areas by placing geometrical shapes directly on the chart.
Powerful analysis tools
Logger Pro offers a wide range of analysis tools, including curve and linear fits, derivatives, tangent lines and integrals. There are also statistics related instruments such as frequency histograms. In addition to this, you can draw prediction graphs and perform peak integration.
Features
- free to download and use;
- compatible with modern Windows versions;
- gives you the ability to analyze large data sets;
- it is possible to add videos, images and text annotations;
- you can create prediction graphs and frequency histograms.


