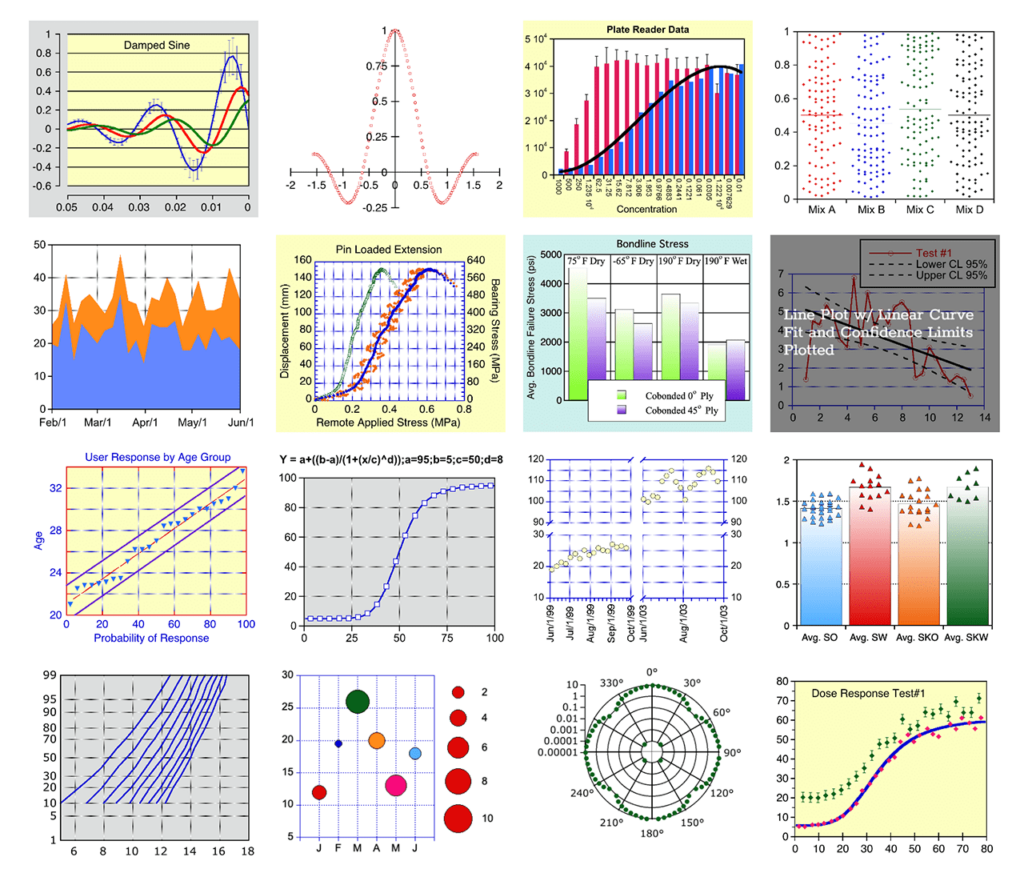
Using this specialized tool scientific researchers can visualize and analyze various types of data. It is possible to create complex pie charts and graphs.
KaleidaGraph
KaleidaGraph is a Windows data visualization utility oriented toward professional scientists and engineers. It is used in a wide range of fields, including physics, chemistry, biology and medicine. You are able to generate line and bar graphs as well as scatter and surface plots.
Chart design
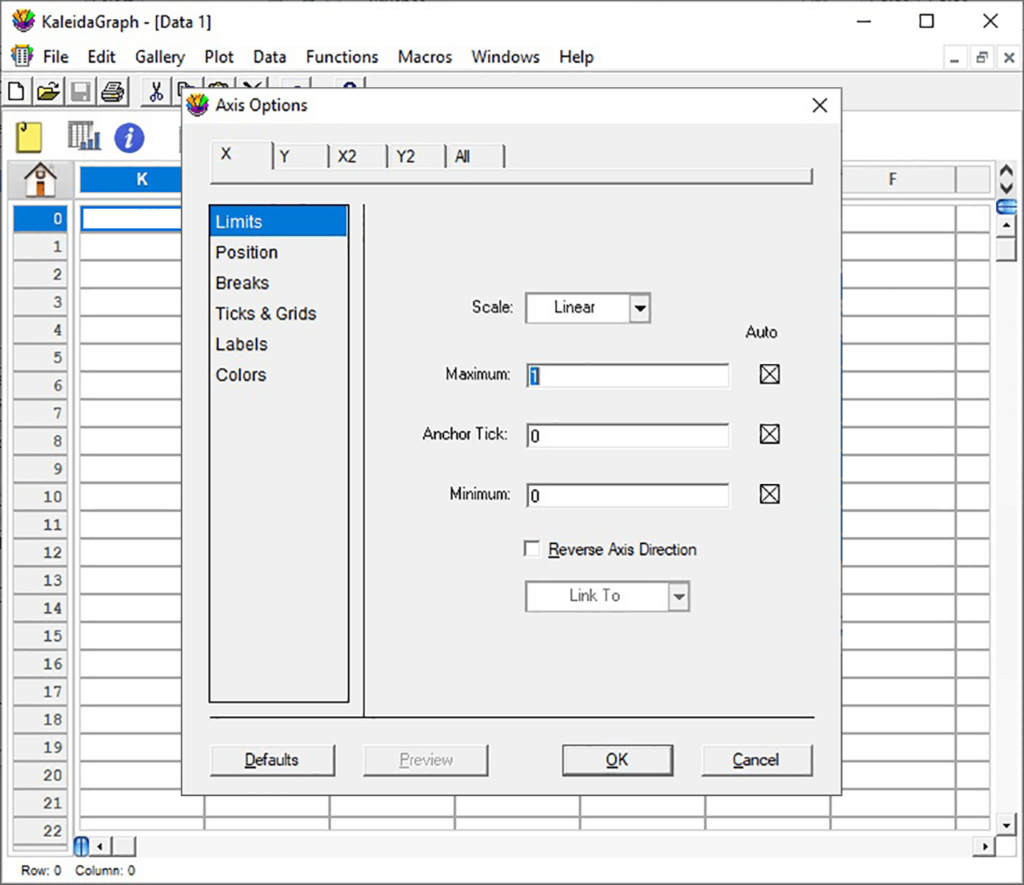
After selecting the required type of graph users can import source data values from external applications like Microsoft Excel or MySQL. It is possible to change the axis labels, insert custom tick marks and configure grid lines.
Please note that the free demo version of KaleidaGraph will stop working 30 days after installation. Other solutions with similar functionality such as FusionCharts are available for download.
Data analysis
You can fit additional curves and indicators to the graph. Moreover, instruments for performing advanced regression analysis and viewing basic plot statistics are included. The program is designed to easily handle large amounts of scientific data.
There are tools for creating personal chart templates. Additionally, users are able to record complex macros to automate repetitive tasks.
Features
- helps scientists visualize any dataset in the form of a chart, graph or plot;
- requires a license to download and use;
- the visual appearance of all axes and grid lines can be customized;
- you can perform various types of statistical and regression analysis;
- compatible with modern versions of Windows.


