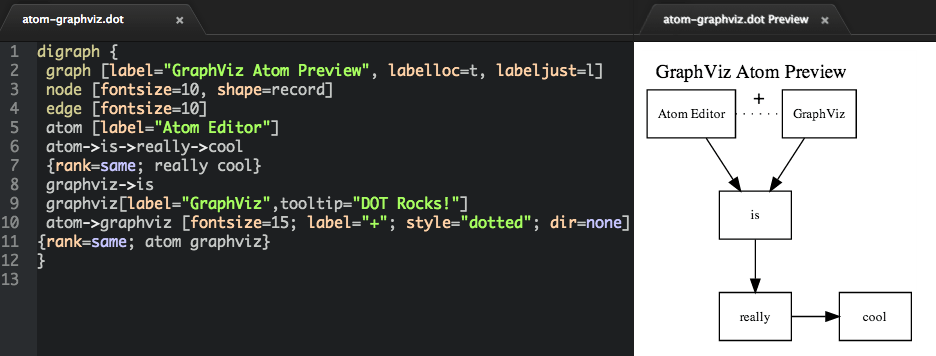
This Python package provides a way to create and render various types of graphs. You can customize the appearance of nodes, edges and labels using the DOT language.
graphviz
graphviz is a Windows utility oriented toward Python developers. It contains tools for generating directed and undirected graphs. The library is widely used in computer science, mathematics, physics and biology.
What it does
With the help of this program you can visualize the architecture of complex software systems to better understand the relationships between different components. Additionally, it is possible to analyze social networks by displaying the map of account connections.
Users are able to monitor the flow of data through a system. This is helpful for getting insights into how the information is processed and transformed. Moreover, there are instruments for generating graphs of the relationships between the tables in a database.
You can create diagrams of flowcharts and algorithms. This functionality is intended for generating software documentation.
Additional information
The package does not require any external libraries to be installed. There is support for a wide range of graph layouts to accommodate various types of input data. Available output file formats include PNG, SVG and PDF.
Features
- free to download and use;
- offers you a Python library for rendering beautiful and informative graphs;
- it is possible to configure the visual appearance of all nodes, edges and labels;
- users can generate detailed diagrams of algorithms and flowcharts;
- compatible with all modern versions of Windows.

