Using this web development tool you can visualize various types of data in the form of charts and heatmaps. All provided templates are written in JavaScript.
FusionCharts
FusionCharts is a Windows program that allows users to create line, bar, pie, column, area, scatter and bubble charts for websites. Additionally, it is possible to build custom online dashboards for various purposes. Please note that the free trial version of FusionCharts will expire 14 days after activation.
Visualization
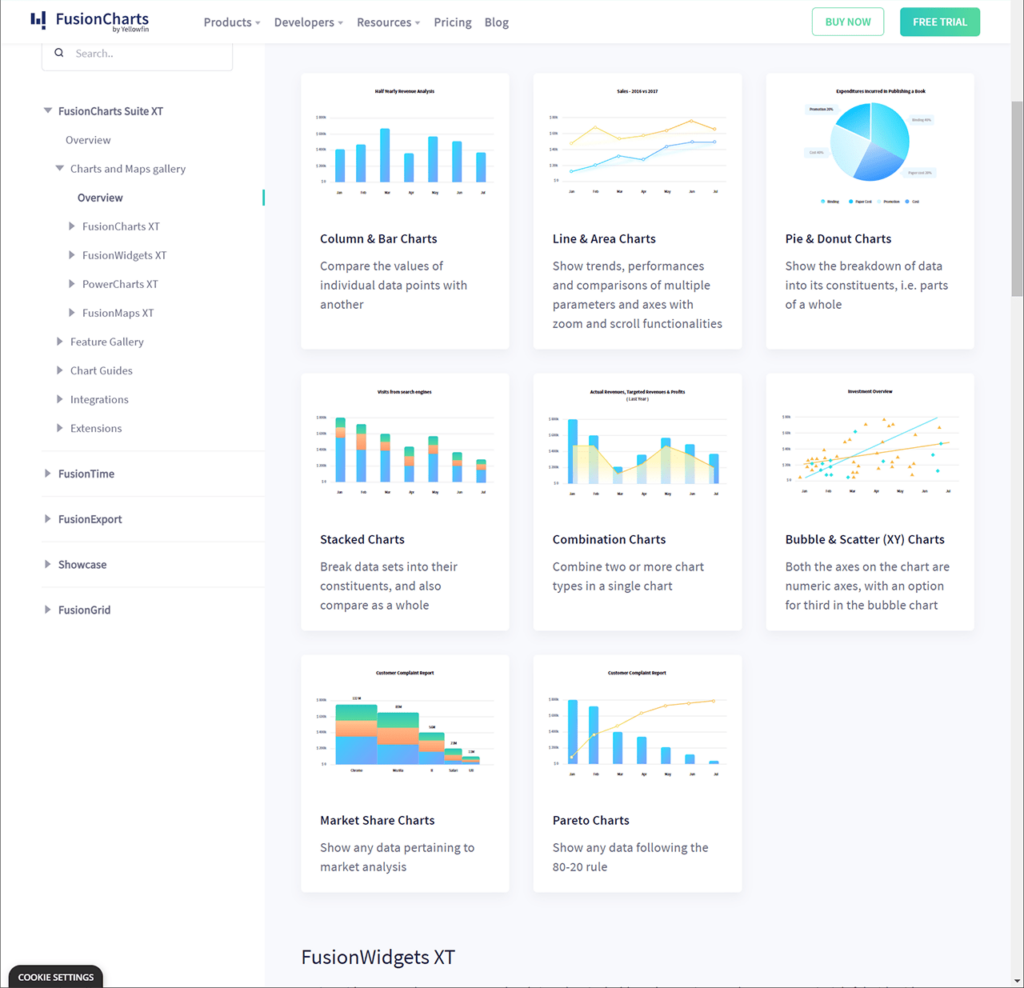
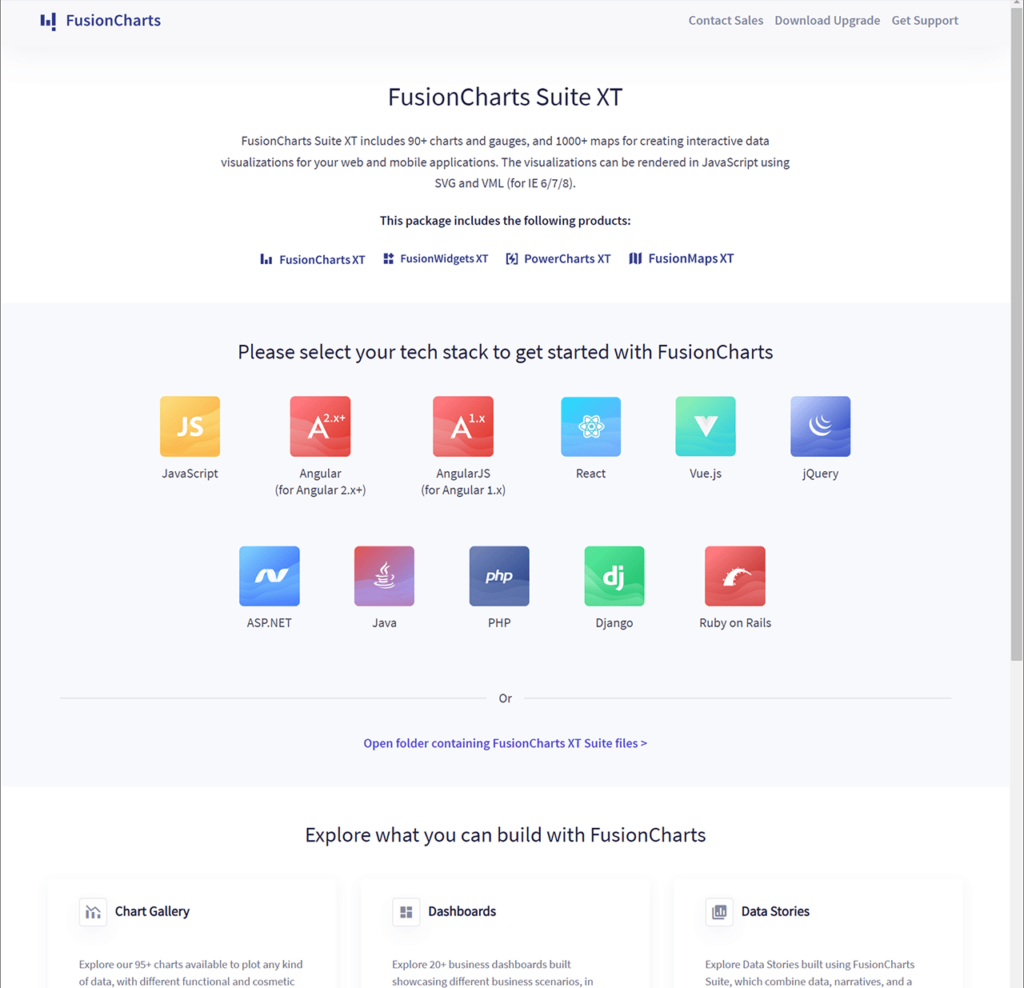
There is a catalog of over 100 different chart and map types. You can personalize the visual appearance of each template to better suit personal requirements. Resulting web pages are optimized for performance and are able to quickly render large datasets.
Like in MaxStat Pro, users can filter information in the chart as well as zoom in and out. These interactive capabilities are helpful for advanced data analysis.
Dashboards
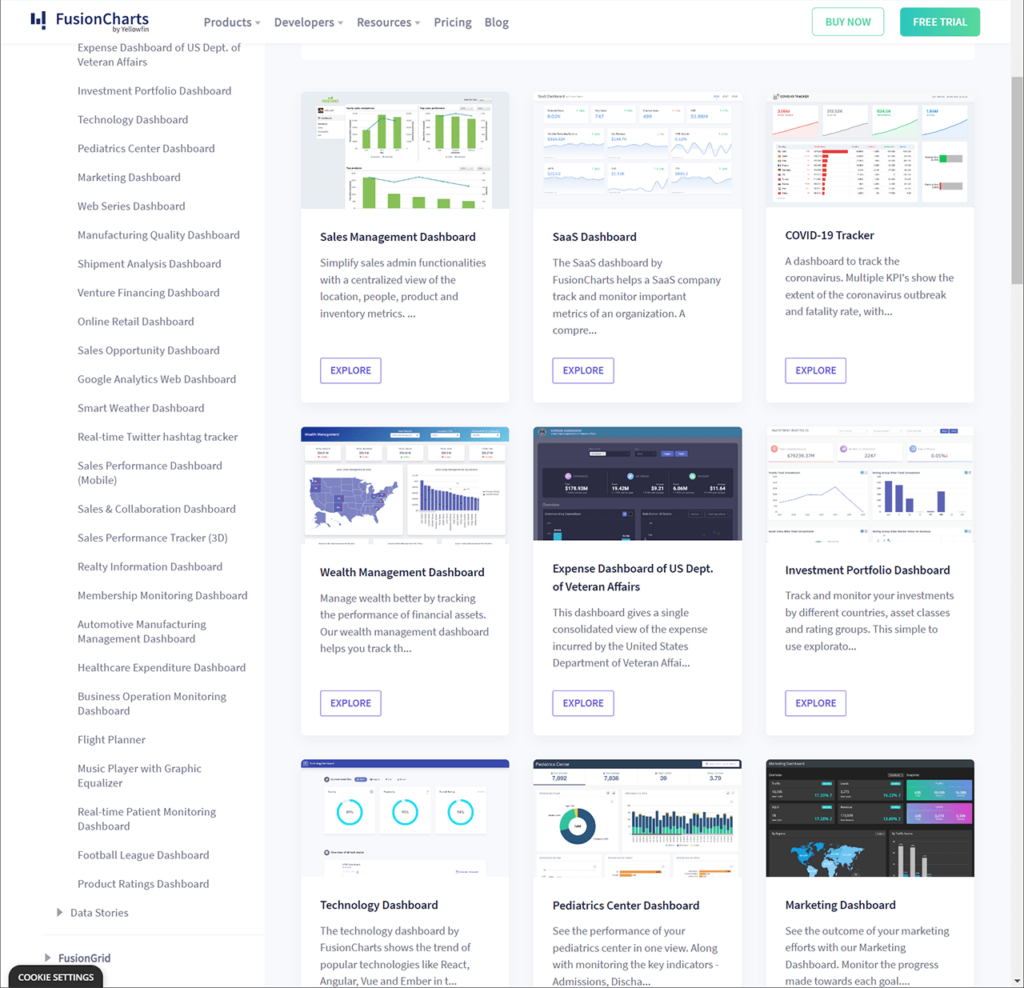
A collection of online dashboards is included. You can configure custom page layouts for monitoring manufacturing quality, analyzing marketing trends, tracking sales performance and a variety of other business scenarios.
Export
Finished charts can be saved to the hard drive as PNG, JPG, SVG or PDF files. Moreover, users are able to directly insert custom JavaScript modules into the website code.
Features
- free to download and use;
- offers you a large selection of JavaScript chart templates for data visualization;
- it is possible to create web dashboards for various business purposes;
- users can export custom charts to several common image formats;
- compatible with all modern versions of Windows.


