Using this program software developers can implement custom charts and graphs into their projects. There is support for multiple common programming languages.
ChartDirector
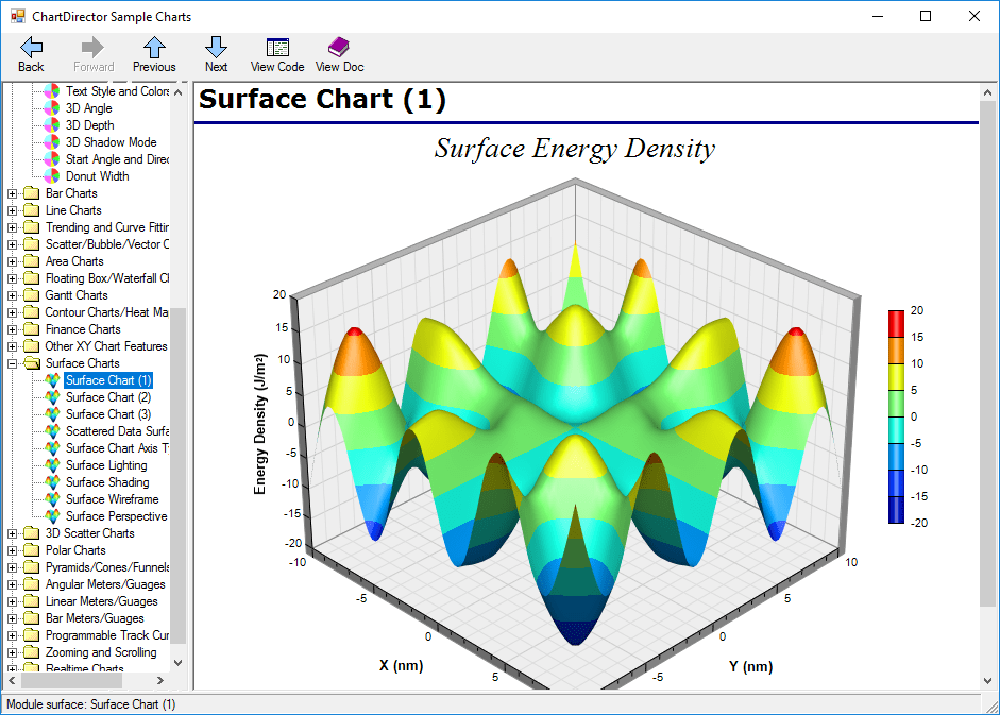
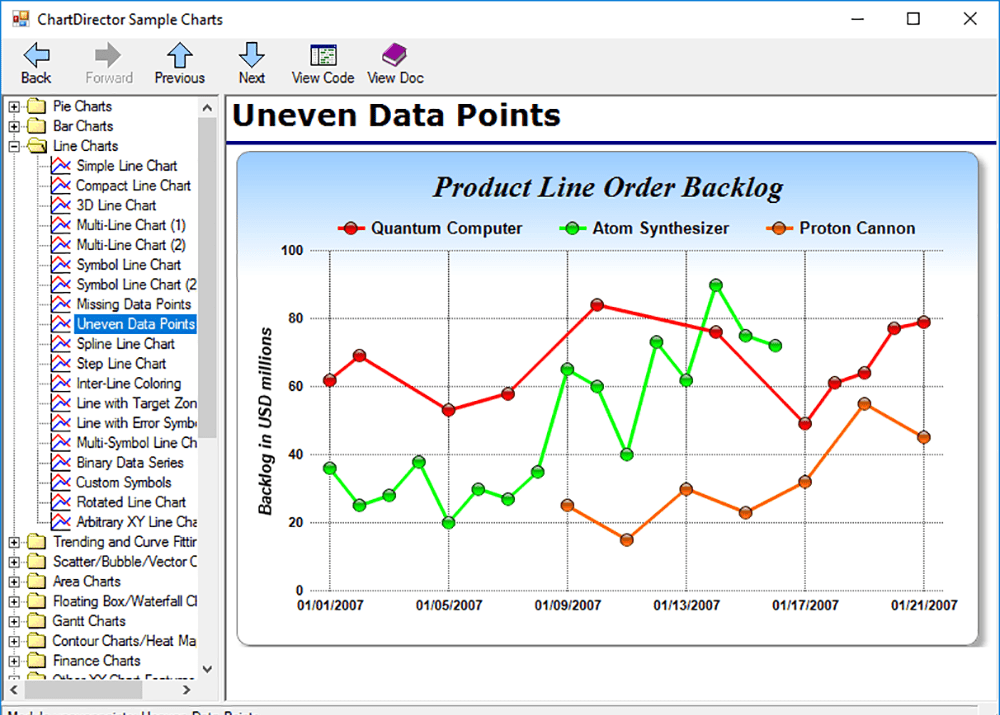
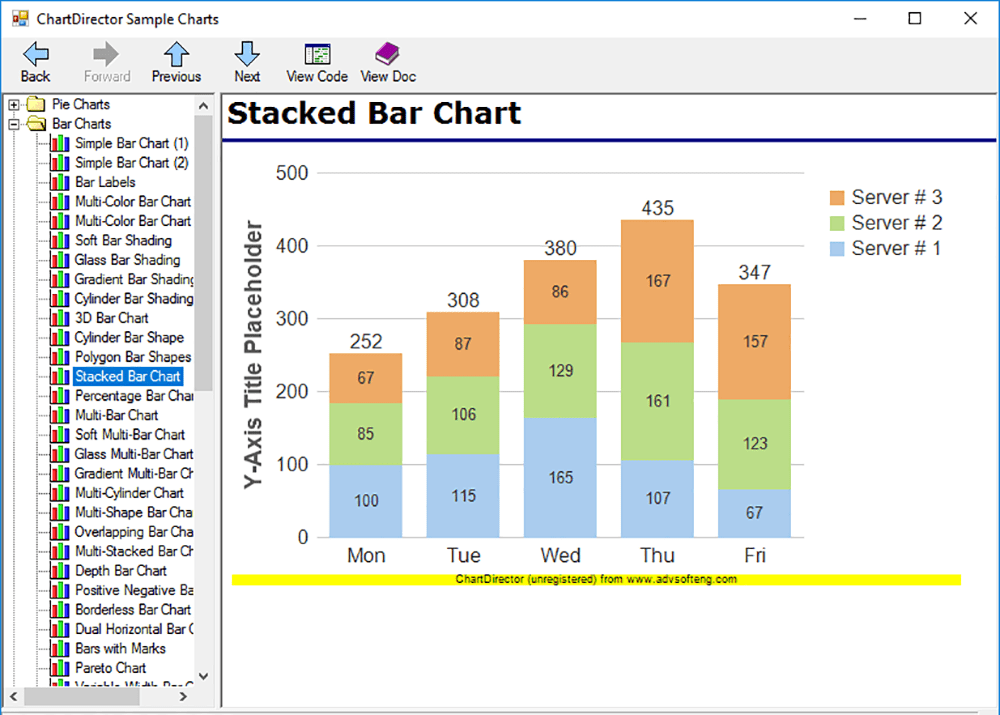
ChartDirector is a Windows development tool for designing graphs and charts to visualize raw numerical values. A large selection of unique styles such as heatmaps and gauges is provided. You are able to zoom, pan and scroll through resulting graphs as well as track dynamic data points with pop up tooltips.
Chart creation
After choosing the visual style users can import source information and generate the output image. It is possible to add candle sticks, OHLC bars, volume indicators and other financial analysis elements for the accurate depiction of current market trends.
Supported programming languages include C++, .NET, Java, PHP, Perl, Python, ASP, etc. You are able to embed charts directly into web pages and application interfaces using server side rendering.
Performance and scalability
There are tools for efficiently generating complex graphs with millions of data points. An option to dynamically update information over time is provided, making ChartDirector ideal for monitoring solutions and online dashboards. The visual appearance of all fonts, axes and legends is fully customizable as well.
Features
- free to download and use;
- offers you instruments for designing informative charts and embedding them into new apps;
- supports a wide range of popular programming languages like Python and PHP;
- it is possible to dynamically update information in resulting charts;
- compatible with all modern versions of Windows.


