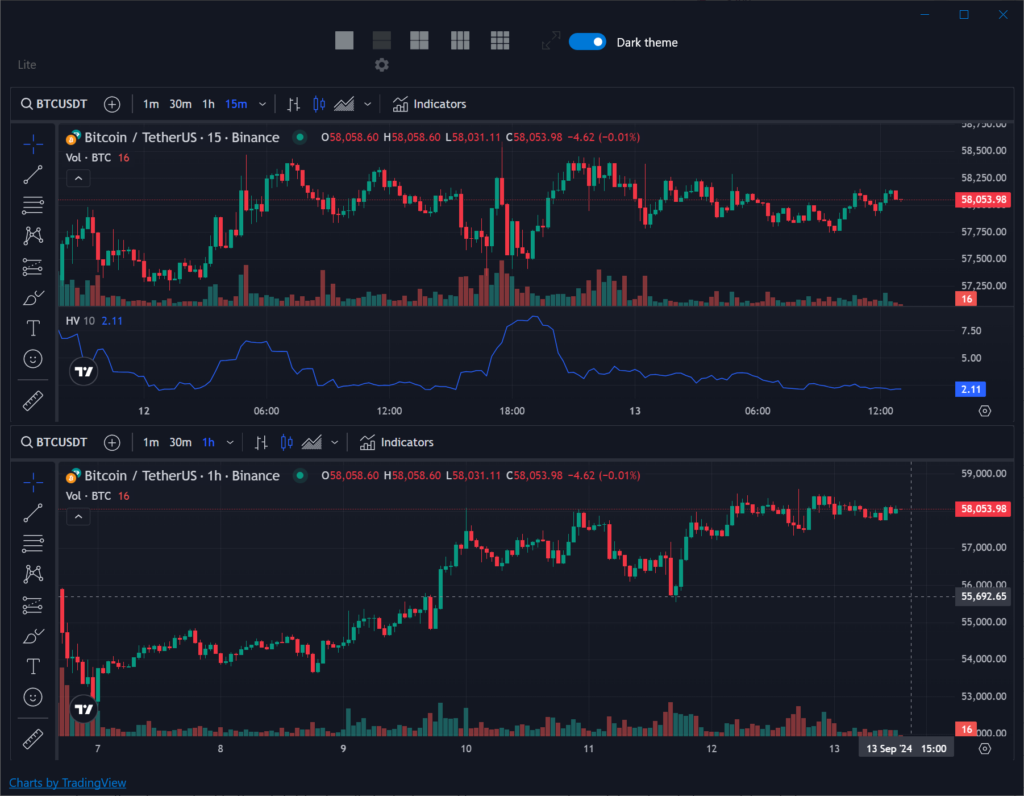
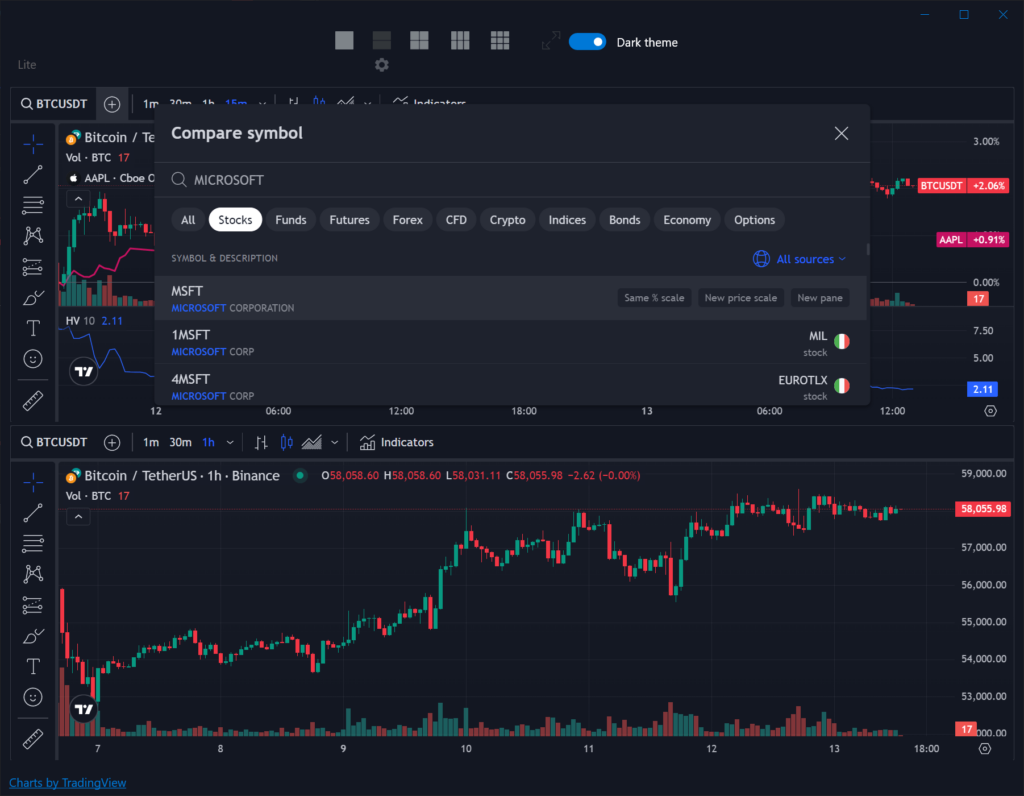
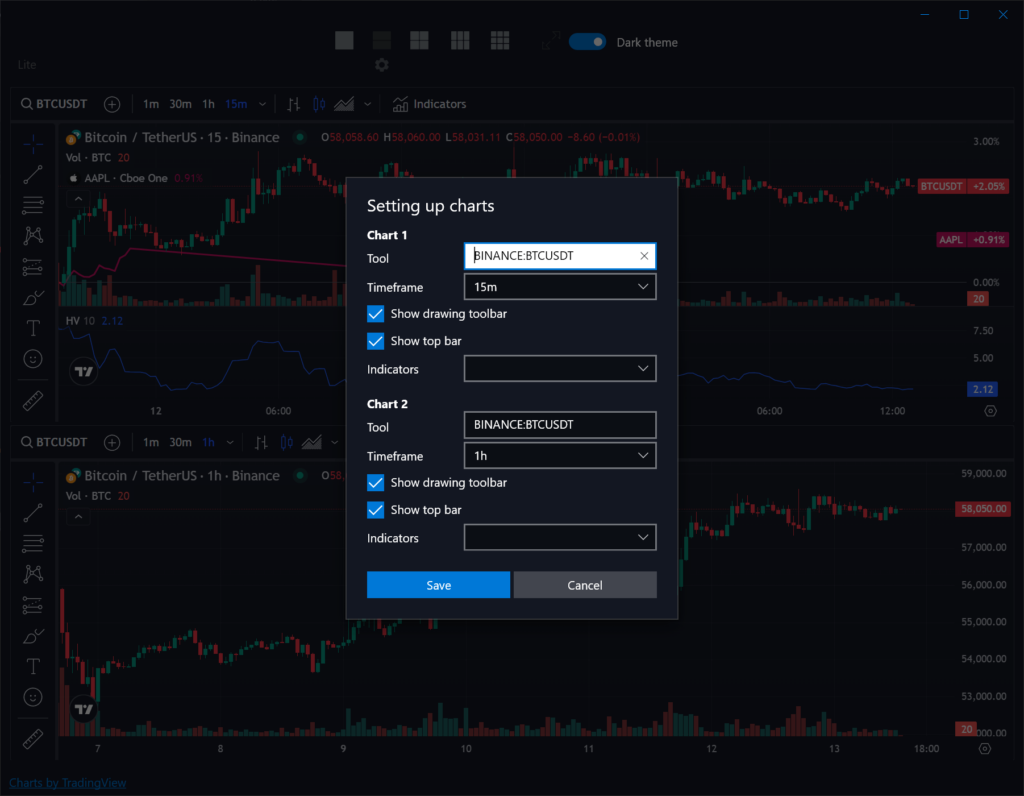
Using this tool you can monitor multiple trading pairs on different online markets at once. It is possible to customize the visual appearance of each price chart.
9Charts
9Charts is a Windows application that enables online traders to monitor the performance of various assets in real time. There is an option to analyze popular technical indicators as well. Please note that the free version of 9Charts provides limited functionality.
Market analysis
After starting the program users can choose the preferred page layout to match their trading style. It is possible to open 1, 2, 4, 6 or 9 charts simultaneously, depending on the subscription level. The next step is to add target trading pairs by entering keywords into the corresponding input field. There is support for a wide range of assets, including:
- Stocks;
- Funds;
- Futures;
- Cryptocurrencies;
- Forex;
- Bonds and more.
Technical indicators
Like in AmiBroker, you are able to view current price resistance levels and trading volumes to evaluate the performance of specific commodities. Instruments for adding RSI lines, directional movement indices and historical volatility graphs are provided as well. Moreover, there is a wide range of advanced indicators such as Keltner Channels, Ichimoku Cloud and Klinger Oscillator.
Features
- free to download and use;
- lets you keep track of personal investments by viewing real time price charts;
- supports multiple types of assets like stocks, crypto, futures and bonds;
- users can evaluate popular technical indicators to make informed financial decisions;
- compatible with modern versions of Windows.


